Gold Layer
At the top of the Medallion Architecture sits the Gold Layer: the final destination for data that has been ingested, cleaned, validated, enriched, and now modeled specifically for consumption by the people and systems that need to act on it. Where the Bronze Layer prioritizes raw fidelity and the Silver Layer prioritizes data quality and trust, the Gold Layer prioritizes business alignment and query performance.
Gold tables are designed for specific consumers and specific questions. Unlike Silver tables, which represent a general-purpose, clean view of enterprise data, Gold tables are purpose-built. A Gold table for the executive sales dashboard is optimized for fast aggregations by region and time period. A Gold table for the machine learning team is structured as a wide, denormalized feature store optimized for model training. A Gold table for regulatory reporting is organized according to the specific format required by the regulatory body. Each Gold table is tailored.
This tailoring is both the Gold Layer’s greatest strength and the main source of confusion about how to manage it. Organizations often end up with a large collection of Gold tables, each serving a slightly different purpose, with varying degrees of overlap. Understanding how to govern and organize the Gold Layer without allowing it to fragment into a new form of data silos requires deliberate architectural planning.
What Gold Tables Contain
Gold tables are almost always pre-aggregated, pre-joined, or otherwise pre-computed. Their defining characteristic is that the expensive analytical work has already been done. When a business analyst’s BI tool queries a Gold table, it should get back its result in seconds, not minutes, because the query is hitting a relatively small table of pre-computed answers rather than scanning billions of raw records.
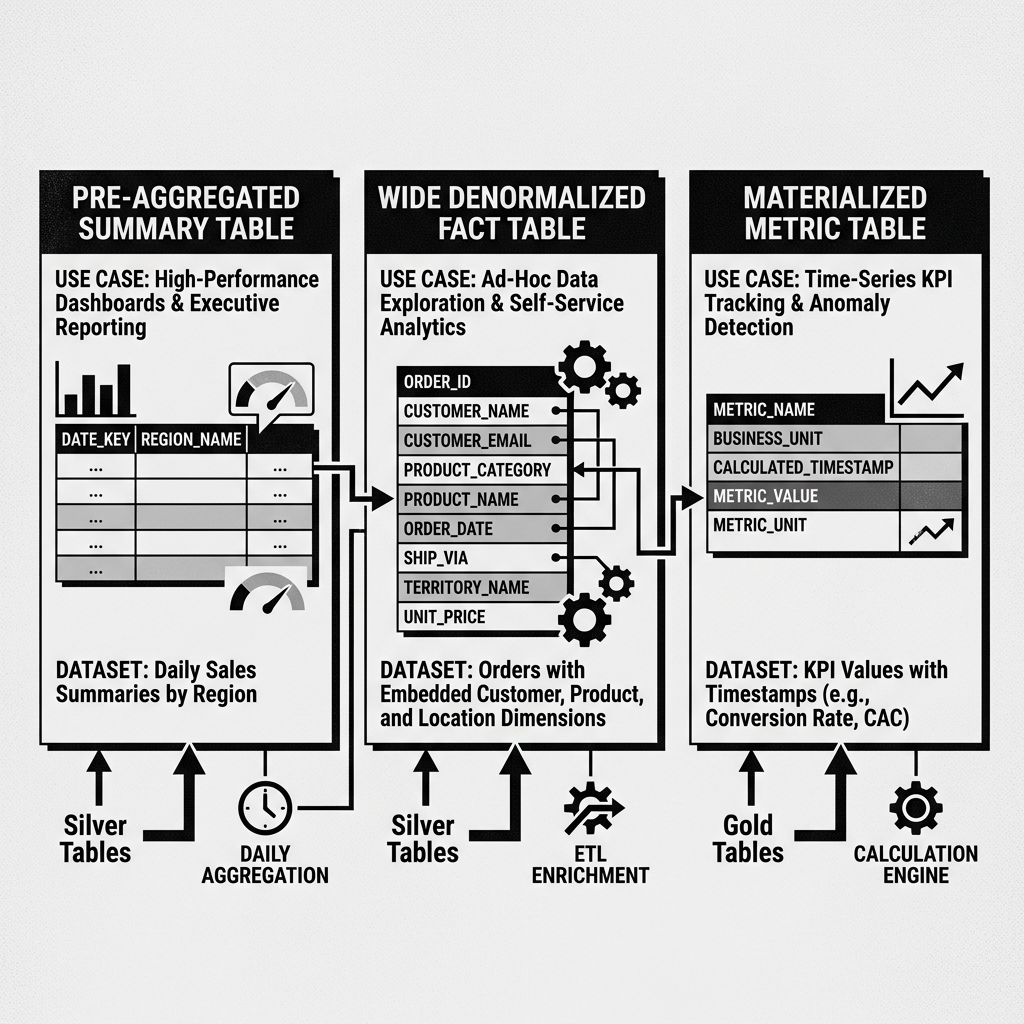
A pre-aggregated summary table might contain the total sales revenue, total units sold, and average order value aggregated by region, product category, and calendar week. Instead of requiring a BI tool to scan and aggregate millions of individual order records on every dashboard load, the tool queries this compact summary table and retrieves results instantly. These tables are rebuilt on a schedule: daily, hourly, or even on a streaming micro-batch basis for dashboards that require near-real-time updates.
A wide denormalized fact table embeds all the dimension attributes directly into the fact table, eliminating the need for joins at query time. Instead of a normalized schema where order records join to customer tables and product tables and location tables, a Gold-layer wide table contains all of these attributes pre-joined into a single, flat row. This pattern trades storage space for query performance, and in a lakehouse where storage is cheap, the tradeoff is almost always worthwhile.
A materialized metric table stores the computed values of specific business KPIs at specific points in time. Rather than recalculating “Monthly Recurring Revenue” from scratch every time it is requested, the metric is calculated once by a Gold pipeline and stored as a row in the metric table. Historical KPI values are preserved, enabling trend analysis and anomaly detection over time.
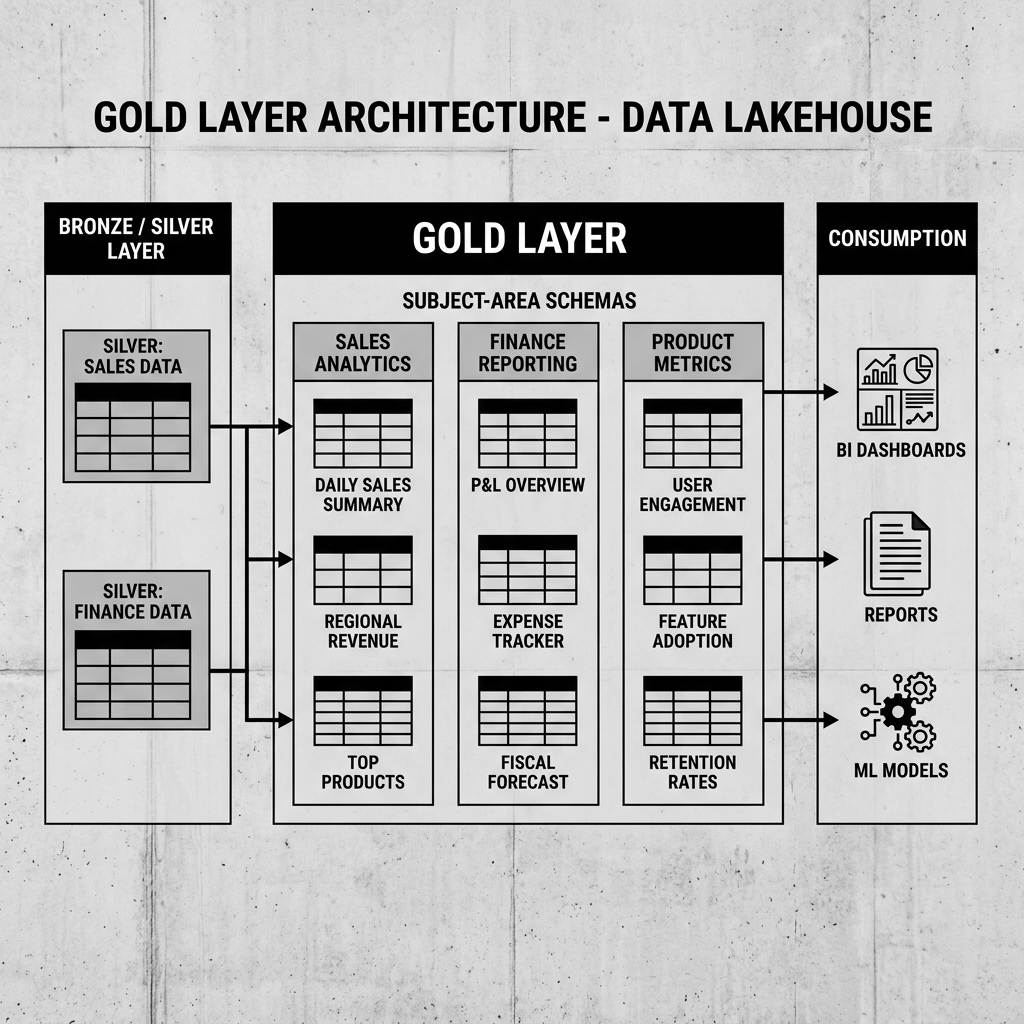
Diagram 1: Gold Layer Architecture
Organizing Gold by Domain
The most effective organizational pattern for the Gold Layer is domain-based schema separation. Rather than placing all Gold tables into a single shared schema, each major business domain gets its own Gold schema: gold_sales, gold_finance, gold_product, gold_marketing.
This separation makes discovery and governance straightforward. A sales analyst looking for revenue data knows to look in gold_sales. A data governance team looking to audit the finance team’s reporting data looks in gold_finance. Access controls can be applied at the schema level, ensuring that only authorized users and systems can query sensitive financial Gold tables.
Domain ownership of Gold tables also maps cleanly onto the Data Mesh principles described elsewhere in this knowledge base. If the sales domain owns gold_sales, the sales data team is responsible for its accuracy, freshness, and documentation. This accountability drives better quality than a central team trying to manage Gold tables for every business domain simultaneously.
Diagram 2: Gold Layer Modeling Patterns
Refresh Strategies
Gold tables can be refreshed in several ways, and the right strategy depends on the latency requirements of the consumers.
Scheduled full rebuilds are the simplest approach. On a nightly schedule, a pipeline drops the Gold table and rebuilds it from scratch by processing all relevant Silver data. This approach is simple to implement and guarantees that the Gold table is always consistent, but it introduces latency (the data is at least hours old) and can be expensive for large Silver tables.
Incremental updates are more complex but more efficient. The Gold pipeline reads only the Silver data that has changed since the last Gold table update, applies the relevant aggregations or joins, and uses an Iceberg merge operation to update the Gold table in place. This approach allows Gold tables to be updated much more frequently, often every 15 to 30 minutes, without the cost of a full rebuild.
Streaming updates build Gold tables in near-real time using a streaming engine like Apache Flink or Spark Structured Streaming. The Gold pipeline subscribes to the Silver table’s change stream and continuously updates the Gold aggregations as new Silver records arrive. This approach minimizes latency but is significantly more complex to implement and maintain.
Gold and the Semantic Layer
In many modern data architectures, the Gold Layer and the Semantic Layer work in close coordination. Gold tables provide the pre-computed, trusted physical datasets that the semantic layer maps to logical business metrics and dimensions. A semantic layer’s definition of “Monthly Revenue” might resolve to a specific column in a specific Gold table, and the semantic layer’s query optimizer knows to use the Gold table’s pre-aggregated values rather than recalculating from Silver.
This combination, Gold tables providing trusted physical data and the semantic layer providing consistent business logic abstraction, gives organizations the best of both worlds: the performance of pre-computed aggregations and the governance consistency of a centralized metric definition.