How Data Lake Table Storage Degrades Over Time
Read the complete Apache Iceberg Masterclass series:
- Part 1: What Are Table Formats and Why Were They Needed?
- Part 2: The Metadata Structure of Modern Table Formats
- Part 3: Performance and Apache Iceberg’s Metadata
- Part 4: Partition Evolution: Change Your Partitioning Without Rewriting Data
- Part 5: Hidden Partitioning: How Iceberg Eliminates Accidental Full Table Scans
- Part 6: Writing to an Apache Iceberg Table: How Commits and ACID Actually Work
- Part 7: What Are Lakehouse Catalogs? The Role of Catalogs in Apache Iceberg
- Part 8: When Catalogs Are Embedded in Storage
- Part 9: How Data Lake Table Storage Degrades Over Time
- Part 10: Maintaining Apache Iceberg Tables: Compaction, Expiry, and Cleanup
- Part 11: Apache Iceberg Metadata Tables: Querying the Internals
- Part 12: Using Apache Iceberg with Python and MPP Query Engines
- Part 13: Approaches to Streaming Data into Apache Iceberg Tables
- Part 14: Hands-On with Apache Iceberg Using Dremio Cloud
- Part 15: Migrating to Apache Iceberg: Strategies for Every Source System This is Part 9 of a 15-part Apache Iceberg Masterclass. Part 8 covered embedded catalogs. This article explains the five ways Iceberg table storage degrades and how to detect each problem before it impacts query performance.
An Iceberg table that works well on day one will not work well on day 365 without maintenance. Every append, update, and delete operation adds files and metadata. Without periodic cleanup and reorganization, query performance gradually deteriorates until someone notices that a dashboard that used to load in 2 seconds now takes 30.
Five Types of Degradation
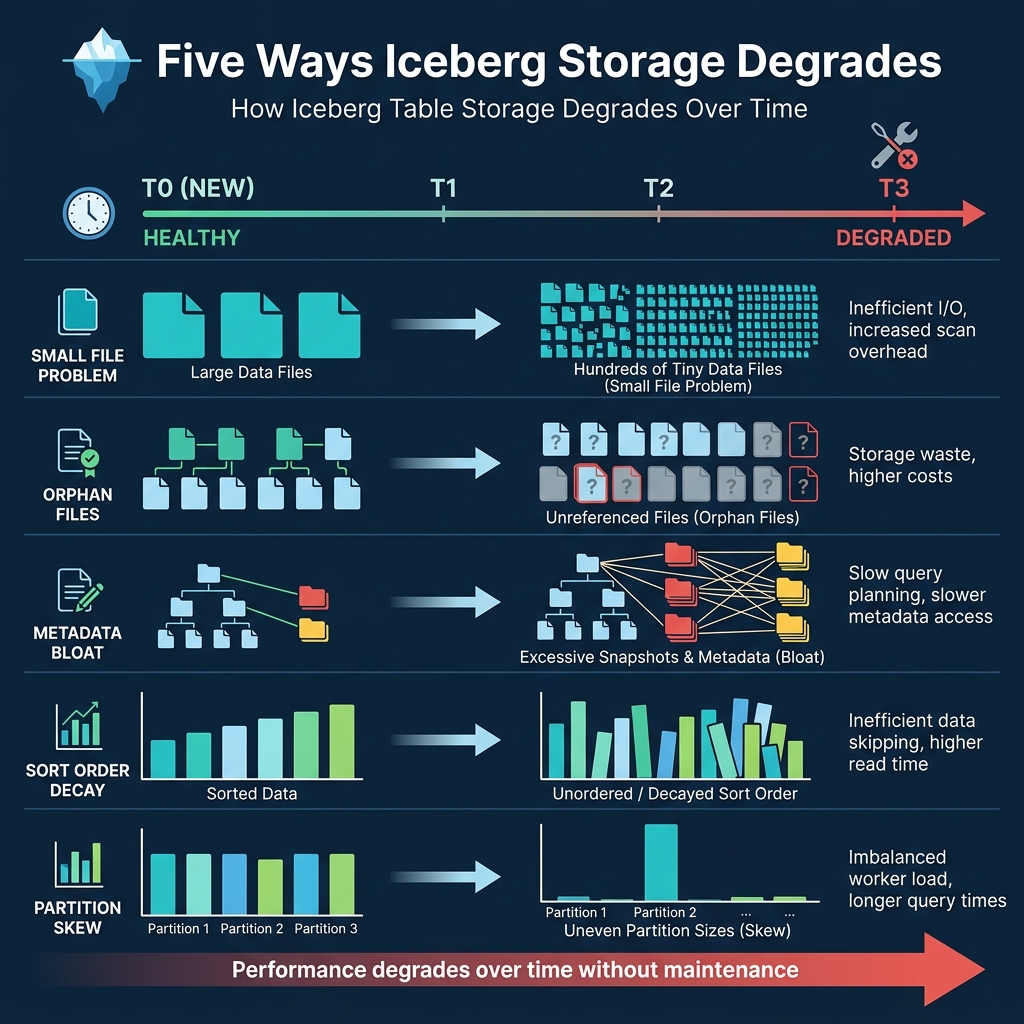
1. The Small File Problem
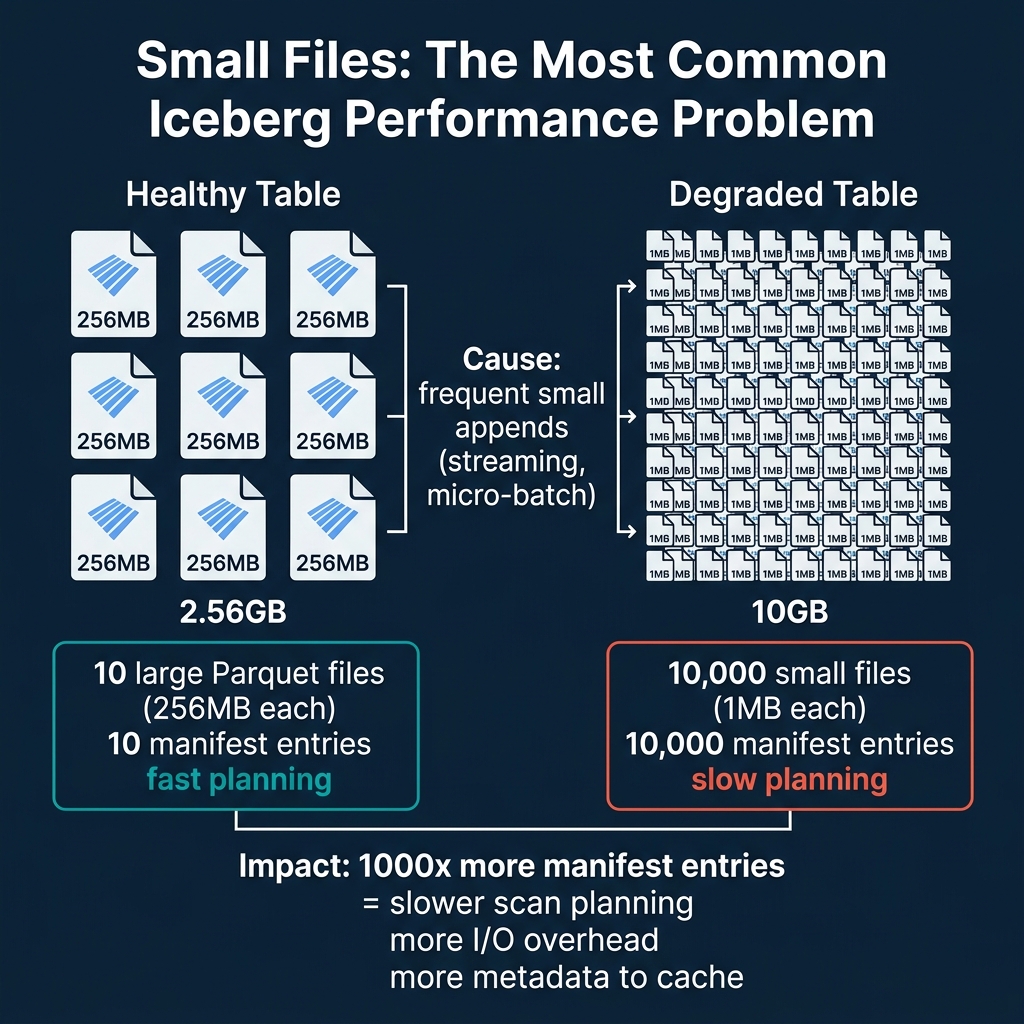
This is the most common and most impactful degradation. Streaming ingestion, micro-batch pipelines, and frequent INSERT operations each create new data files. If these operations produce many small files (under 32 MB), the table accumulates thousands of files where dozens would suffice.
Impact: Each file becomes a manifest entry. A table with 10,000 small files has 10,000 entries that the query planner must evaluate, compared to 40 entries for the same data in properly-sized 256 MB files. Planning time increases linearly with file count.
Cause: Frequent commits with small amounts of data. A streaming pipeline committing every 30 seconds might add 2-3 files per commit, producing 5,000+ files per day.
2. Orphan Files
Orphan files are data files that exist in storage but are not referenced by any current or retained snapshot. They accumulate from:
- Failed writes: A write that crashes after creating data files but before committing (Part 6) leaves orphan files.
- Expired snapshots: When snapshots are expired, the metadata references are removed, but the underlying data files remain in storage until explicitly cleaned up.
- Compaction: When compaction merges files, the old files become orphans after their snapshots are expired.
Impact: Orphan files waste storage space and money. A heavily-written table can accumulate terabytes of orphan files over months. In one common scenario, a daily batch pipeline writing 50 GB per day with weekly compaction can produce 350 GB of orphan files every week. Without cleanup, this costs thousands of dollars annually in storage fees alone.
3. Metadata Bloat
Every commit creates a new snapshot in metadata.json. Over time, the metadata file grows as the snapshot list lengthens. The manifest list for each snapshot may also reference many manifest files, especially if the table has been modified in many different partitions.
Impact: The metadata.json file becomes large, taking longer to download from object storage. At 10,000+ snapshots, the metadata file itself can exceed 100 MB, adding seconds to every query’s planning phase. The manifest list grows, making scan planning slower because there are more manifests to evaluate.
How to detect it: Check the snapshot count using metadata tables. If it exceeds 1,000, configure snapshot expiry to keep the count manageable.
4. Sort Order Decay
If a table has a declared sort order (e.g., sorted by customer_id for efficient lookups), new data written by different engines or pipelines may not respect this sort order. Over time, the min/max statistics per file widen as new unsorted data is mixed with sorted data.
Impact: File skipping becomes less effective. As described in Part 3, tight min/max ranges enable file pruning. Wide ranges mean no files can be skipped. A well-sorted table might skip 95% of files for a filtered query, while the same table with decayed sort order might skip only 10%.
How to fix it: Run compaction with sorting to rewrite files in the correct order and restore tight min/max ranges.
5. Partition Skew
Some partitions grow much larger than others. An event table partitioned by day(event_time) might have 10 GB on a normal day but 500 GB during a promotional event. The oversized partition contains files that are too large or too numerous for efficient processing.
Impact: Queries against skewed partitions are slower because they must process disproportionately more data. Parallel execution becomes unbalanced when one partition’s task takes 50x longer than the others.
Real-World Degradation Timeline
Consider a table receiving 100 small appends per day from a streaming pipeline:
- Day 1: 100 small files (3 MB each), 300 MB total. Queries are fast.
- Day 30: 3,000 small files, 9 GB total. Query planning starts to slow noticeably.
- Day 90: 9,000 small files, 27 GB total. Every query scans all 9,000 manifest entries. Dashboard queries that took 2 seconds now take 15 seconds.
- Day 180: 18,000 small files plus thousands of orphan files from expired snapshots. Metadata file is 50+ MB. Planning alone takes 10 seconds before any data is read.
Without compaction, the table becomes nearly unusable for interactive analytics within 6 months. With daily compaction, the same table stays at 40-50 well-sized files regardless of how many commits happen each day.
How to Diagnose Table Health
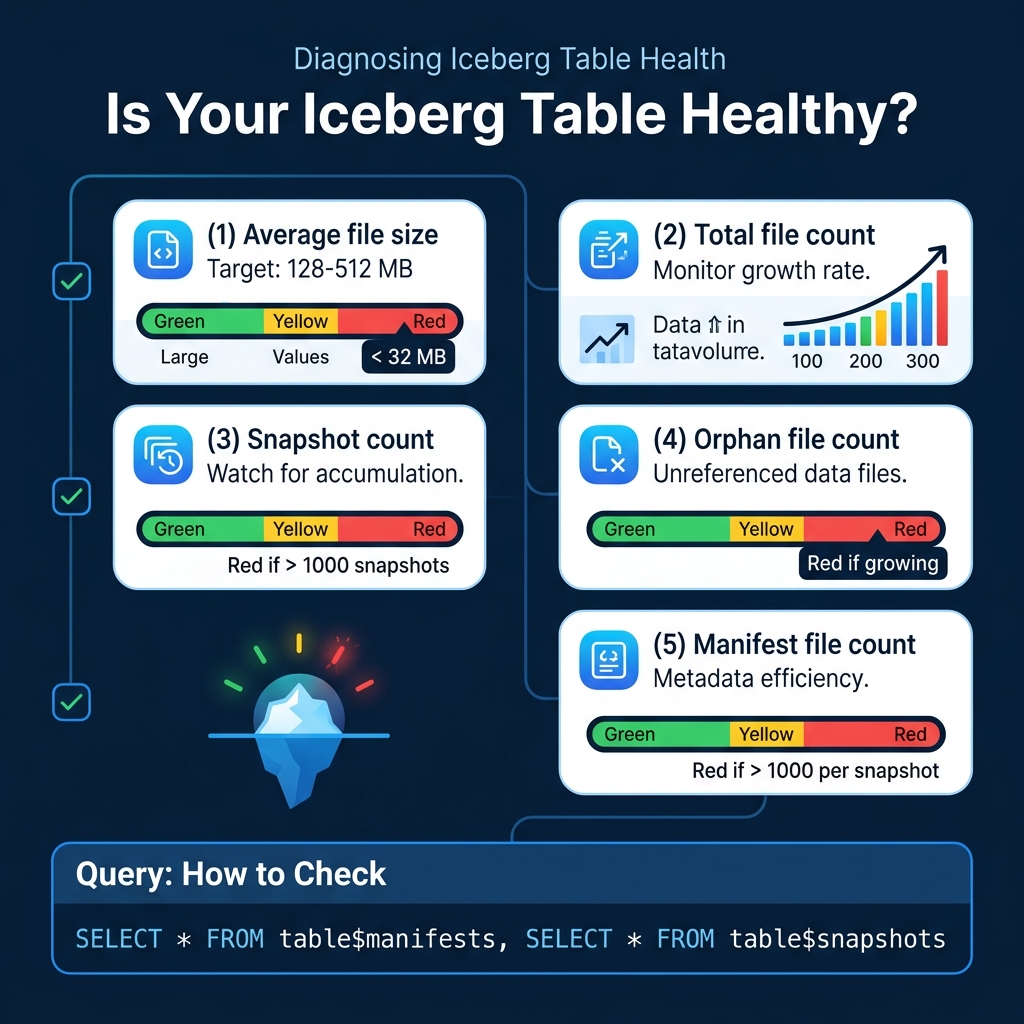
Iceberg provides metadata tables that let you inspect table health. Here are the key diagnostic queries:
Check File Sizes (Dremio / Spark)
-- Average file size
SELECT AVG(file_size_in_bytes) / 1024 / 1024 AS avg_mb
FROM TABLE(table_files('analytics.orders'))
If average file size is below 32 MB, you have a small file problem. Target: 128-512 MB.
Check Snapshot Count
-- How many snapshots exist?
SELECT COUNT(*) AS snapshot_count
FROM TABLE(table_snapshot('analytics.orders'))
If snapshot count exceeds 1,000, you should expire older snapshots.
Check File Count Growth
-- Files per partition
SELECT partition, COUNT(*) AS file_count
FROM TABLE(table_files('analytics.orders'))
GROUP BY partition
ORDER BY file_count DESC
Partitions with hundreds of files are candidates for compaction.
Dremio supports all Iceberg metadata table queries and provides a SQL interface for monitoring table health.
The Maintenance Imperative
Every Iceberg table in production needs maintenance. The question is not whether to maintain tables but how: manually, through scheduled jobs, or through automated services. Part 10 covers all three approaches in detail.
The cost of not maintaining Iceberg tables is both direct (wasted storage from orphan files) and indirect (slow queries leading to poor user experience, excessive cloud compute costs from reading unnecessary data). Organizations with hundreds of Iceberg tables often find that a single data engineer dedicated to table maintenance saves more in compute and storage costs than their salary. Automated maintenance through Dremio or S3 Tables removes this operational burden entirely.
Books to Go Deeper
- Architecting the Apache Iceberg Lakehouse by Alex Merced (Manning)
- Lakehouses with Apache Iceberg: Agentic Hands-on by Alex Merced
- Constructing Context: Semantics, Agents, and Embeddings by Alex Merced
- Apache Iceberg & Agentic AI: Connecting Structured Data by Alex Merced
- Open Source Lakehouse: Architecting Analytical Systems by Alex Merced