Apache Iceberg Metadata Tables: Querying the Internals
Read the complete Apache Iceberg Masterclass series:
- Part 1: What Are Table Formats and Why Were They Needed?
- Part 2: The Metadata Structure of Modern Table Formats
- Part 3: Performance and Apache Iceberg’s Metadata
- Part 4: Partition Evolution: Change Your Partitioning Without Rewriting Data
- Part 5: Hidden Partitioning: How Iceberg Eliminates Accidental Full Table Scans
- Part 6: Writing to an Apache Iceberg Table: How Commits and ACID Actually Work
- Part 7: What Are Lakehouse Catalogs? The Role of Catalogs in Apache Iceberg
- Part 8: When Catalogs Are Embedded in Storage
- Part 9: How Data Lake Table Storage Degrades Over Time
- Part 10: Maintaining Apache Iceberg Tables: Compaction, Expiry, and Cleanup
- Part 11: Apache Iceberg Metadata Tables: Querying the Internals
- Part 12: Using Apache Iceberg with Python and MPP Query Engines
- Part 13: Approaches to Streaming Data into Apache Iceberg Tables
- Part 14: Hands-On with Apache Iceberg Using Dremio Cloud
- Part 15: Migrating to Apache Iceberg: Strategies for Every Source System This is Part 11 of a 15-part Apache Iceberg Masterclass. Part 10 covered maintenance operations. This article covers the metadata tables that let you inspect Iceberg table internals using standard SQL.
Iceberg exposes its internal metadata as queryable virtual tables. You can use them to check table health, debug performance issues, audit changes, and build monitoring dashboards. No special tools required, just SQL.
The Seven Metadata Tables
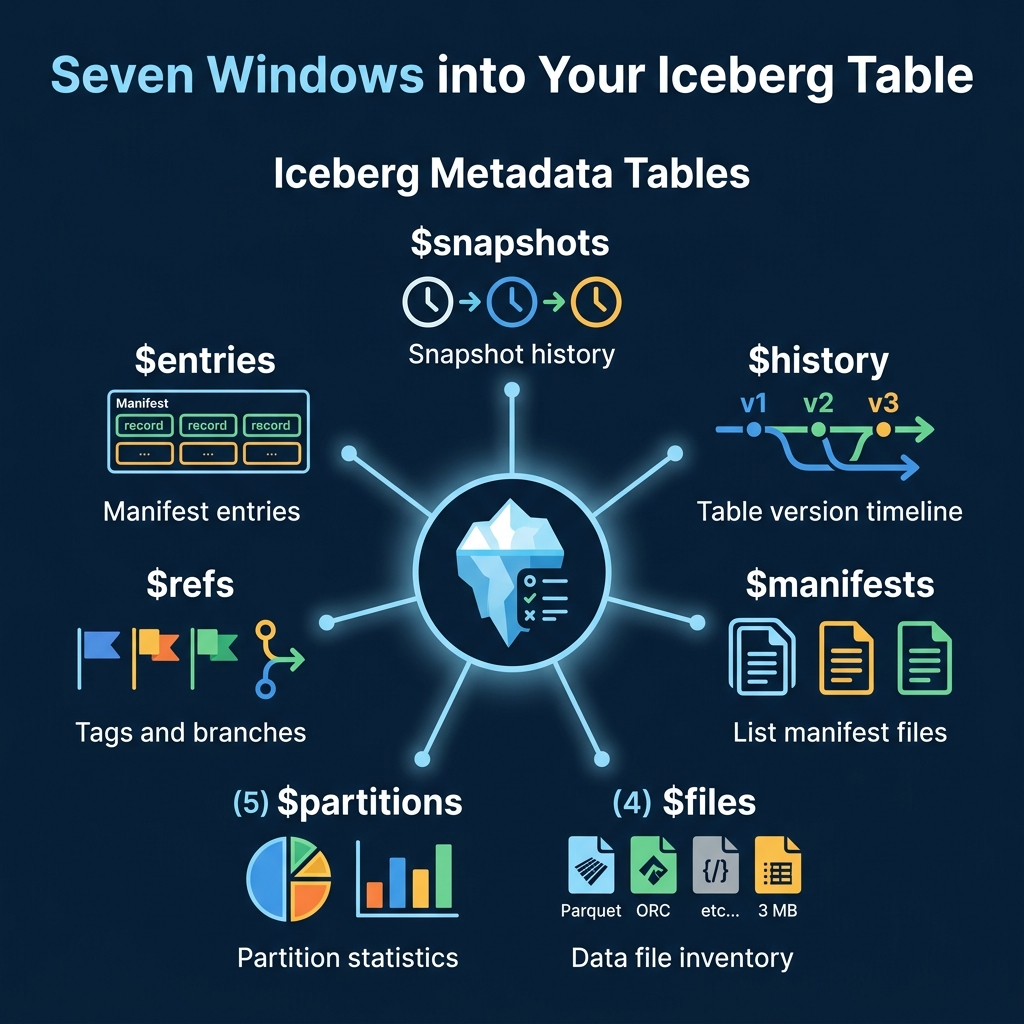
Snapshots
The $snapshots table lists every snapshot in the table’s history. Each row represents a committed transaction.
-- Dremio syntax
SELECT * FROM TABLE(table_snapshot('analytics.orders'))

-- Spark syntax
SELECT * FROM analytics.orders.snapshots
Key columns: snapshot_id, committed_at, operation (append, overwrite, delete), summary (files added/removed counts).
History
The $history table shows the timeline of which snapshot was current at each point in time.
SELECT * FROM TABLE(table_history('analytics.orders'))Files
The $files table lists every data file in the current snapshot with detailed statistics.
SELECT file_path, file_size_in_bytes, record_count, partition
FROM TABLE(table_files('analytics.orders'))
This is the primary diagnostic table for checking file sizes and identifying the small file problem.
Manifests
The $manifests table lists the manifest files for the current snapshot.
SELECT path, length, added_data_files_count, existing_data_files_count
FROM TABLE(table_manifests('analytics.orders'))
Partitions
The $partitions table provides statistics per partition: row counts, file counts, and size.
SELECT partition, record_count, file_count
FROM TABLE(table_partitions('analytics.orders'))
Practical Use Cases
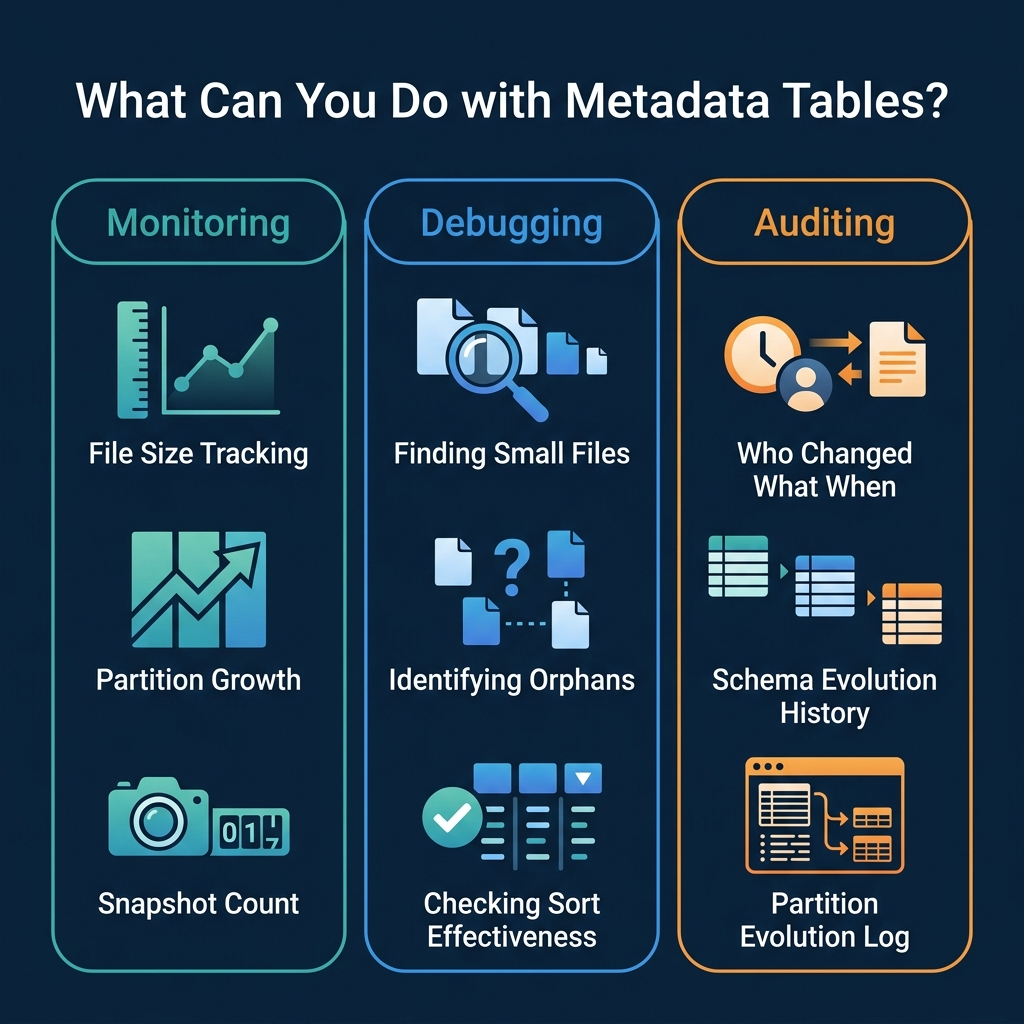
Monitoring: Average File Size
SELECT
  AVG(file_size_in_bytes) / 1048576 AS avg_file_mb,
  MIN(file_size_in_bytes) / 1048576 AS min_file_mb,
  COUNT(*) AS total_files
FROM TABLE(table_files('analytics.orders'))
If avg_file_mb drops below 64, schedule compaction.
Debugging: Files Per Partition
SELECT partition, COUNT(*) AS files, SUM(record_count) AS rows
FROM TABLE(table_files('analytics.orders'))
GROUP BY partition
ORDER BY files DESC
LIMIT 20
Partitions with hundreds of files are compaction candidates. Use this query as a daily health check and pipe the results into your monitoring system.
Debugging: Sort Order Effectiveness
Column statistics in the files table reveal whether your sort order is effective:
SELECT
  file_path,
  lower_bounds['customer_id'] AS min_customer_id,
  upper_bounds['customer_id'] AS max_customer_id
FROM TABLE(table_files('analytics.orders'))
If the min/max ranges overlap heavily across files, the sort order has decayed and compaction with sorting (Part 10) will restore effectiveness.
Monitoring: Commit Velocity
Track how frequently the table is being written to:
SELECT
  DATE_TRUNC('hour', committed_at) AS hour,
  COUNT(*) AS commits,
  SUM(CAST(summary['added-data-files'] AS INT)) AS files_added
FROM TABLE(table_snapshot('analytics.orders'))
WHERE committed_at > CURRENT_TIMESTAMP - INTERVAL '24' HOUR
GROUP BY DATE_TRUNC('hour', committed_at)
ORDER BY hour
High commit velocity (hundreds of commits per hour) indicates a streaming workload that needs aggressive compaction.
Auditing: Recent Changes
SELECT committed_at, operation, summary
FROM TABLE(table_snapshot('analytics.orders'))
ORDER BY committed_at DESC
LIMIT 10
This shows the last 10 operations: how many files were added or removed per commit.
Time Travel
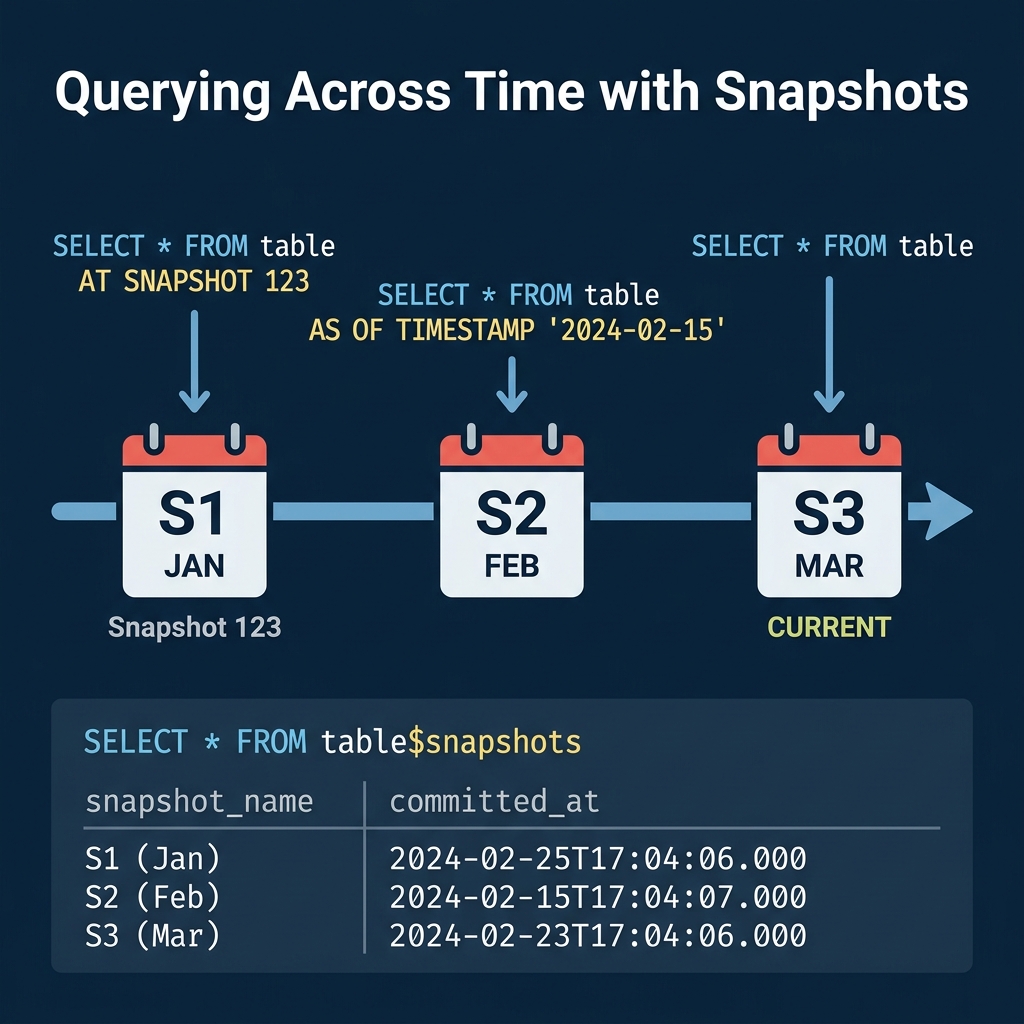
Metadata tables enable time travel queries. Use the snapshot list to find the snapshot ID for a specific point in time, then query the table at that snapshot:
-- Query the table as it existed on February 15
SELECT * FROM analytics.orders
AT SNAPSHOT '1234567890123456789'

-- Or by timestamp
SELECT * FROM analytics.orders
AT TIMESTAMP '2024-02-15 00:00:00'
Time travel is useful for debugging data issues (“what did this table look like before yesterday’s pipeline ran?”), auditing (“what was the account balance at end-of-quarter?”), and reproducible analysis (“run this report against last month’s data”).
Incremental Reads
Metadata tables also enable incremental processing. By comparing two snapshots, you can identify which files were added between them and process only the new data:
-- Find files added in the last snapshot
SELECT file_path, record_count
FROM TABLE(table_files('analytics.orders'))
WHERE file_path NOT IN (
  SELECT file_path FROM TABLE(table_files('analytics.orders'))
  AT SNAPSHOT '1234567890'
)
This pattern is the foundation for CDC (Change Data Capture) on Iceberg tables: read only what changed since the last processing run, rather than re-scanning the entire table.
Rollback
If a bad write corrupts your table, use the snapshot list to rollback:
-- Find the last good snapshot
SELECT snapshot_id, committed_at, operation
FROM TABLE(table_snapshot('analytics.orders'))
ORDER BY committed_at DESC

-- Rollback to it (Spark)
CALL system.rollback_to_snapshot('analytics.orders', 1234567890)
Rollback does not delete data. It simply changes the current snapshot pointer to an earlier snapshot, making the table appear as it was at that point. The rolled-back data files remain in storage for potential recovery.
Dremio supports all Iceberg metadata table queries through its TABLE() function syntax and provides time travel in both SQL and its semantic layer.
Building a Health Dashboard
Combine metadata table queries into a scheduled monitoring job:
-- Table health summary
SELECT
  (SELECT COUNT(*) FROM TABLE(table_snapshot('analytics.orders'))) AS snapshots,
  (SELECT COUNT(*) FROM TABLE(table_files('analytics.orders'))) AS files,
  (SELECT AVG(file_size_in_bytes)/1048576 FROM TABLE(table_files('analytics.orders'))) AS avg_mb,
  (SELECT COUNT(*) FROM TABLE(table_manifests('analytics.orders'))) AS manifests
Set alerts when snapshots exceed 1,000, average file size drops below 64 MB, or manifest count exceeds 500.
Engine Syntax Variations
Different engines use different syntax for metadata tables:
| Engine | Syntax |
|---|---|
| Dremio | TABLE(table_files('db.table')) |
| Spark | db.table.files |
| Trino | "db"."table$files" |
| Flink | table$files |
The underlying data is identical; only the SQL syntax differs. Regardless of which engine you use, these metadata tables are the key diagnostic tool for understanding and maintaining Iceberg table health.
Automating Decisions with Metadata
You can use metadata table queries to drive automated maintenance decisions. For example, a scheduler can check whether compaction is needed before running it:
-- Only compact if average file size is below threshold
SELECT CASE
  WHEN AVG(file_size_in_bytes) / 1048576 < 64 THEN 'COMPACT_NEEDED'
  ELSE 'HEALTHY'
END AS table_status
FROM TABLE(table_files('analytics.orders'))
This avoids running compaction on tables that are already well-organized, saving compute costs and preventing unnecessary data rewrites.
For production environments, integrate these checks into your orchestration tool (Airflow, Dagster, Prefect). Schedule a daily metadata scan across all tables, collect the health metrics, and trigger maintenance jobs only for tables that need them. This approach scales to hundreds of tables without manual oversight. Dremio’s autonomous optimization automates this entire workflow for tables managed by Open Catalog.
Part 12 covers using Iceberg from Python and MPP query engines.
Books to Go Deeper
- Architecting the Apache Iceberg Lakehouse by Alex Merced (Manning)
- Lakehouses with Apache Iceberg: Agentic Hands-on by Alex Merced
- Constructing Context: Semantics, Agents, and Embeddings by Alex Merced
- Apache Iceberg & Agentic AI: Connecting Structured Data by Alex Merced
- Open Source Lakehouse: Architecting Analytical Systems by Alex Merced